![[pencil cone]](images/pencil_cone.gif)
This page is joint work with Michael Falk.
Suppose f(x, y, z) and g(x, y, z) are both homogeneous polynomials of the same degree. Then
This page shows 4 different pencils. In each case there are 3 different ways of visualizing the pencil
arrangement_2d shows a 2-dimensional animation were θ increases with time by the formula
arrangement_3d shows the 3-dimensional animation.
arrangement_3d_no_planes is a 3-dimensional animation without the planes of the singular curves.
To understand the pencil, ``2d'' is probably the best. The prettiest pictures are obtained with ``3d_no_planes.''
The arrangements are:
Braid arrangement (or A3, or tetrahedron)
f(x, y, z) = x2 - z2 and g(x, y, z) = f(y, x, z)
braid_2d
braid_3d
braid_3d_no_planes
To see the DPGraph figure, click on the link. To get back to this page, exit DPGraph.
Cube arrangement (or B3)
f(x, y, z) = y2 ( x2 - z2) and g(x, y, z) = f(y, x, z)
cube_2d
cube_3d
cube_3d_no_planes
Terao-Falk arrangement
f(x, y, z) = ( x2 - z2)( 9 y2 - z2)
and g(x, y, z) = f(y, x, z)
TF_2d
TF_3d
TF_3d_no_planes (This is the graph featured at the top of the page.)
Pappus arrangement
f(x, y, z) = (y-z)(2y+x+z)(2y-x+z) and g(x, y, z) = f(x, y, -z)
Pappus_2d
Pappus_3d
Pappus_3d_no_planes
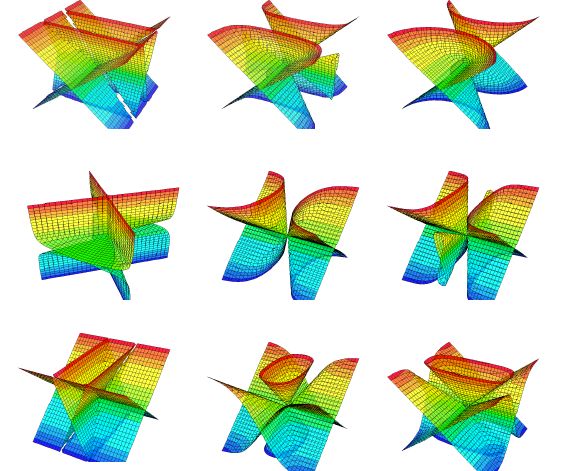
Here's a series of stills from the "featured" graph, TF_3d_no_planes.
These graphs were produced by
DPGraph,
which is a fast program for
viewing 3D objects.