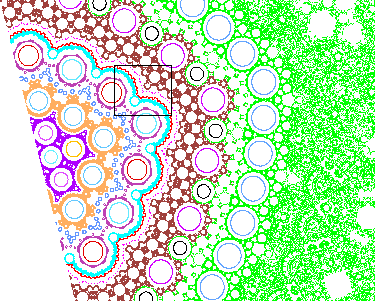
 This figure is a rather powerful blow-up. The discontinuty at x = -1
is shown as the diagonal line at the left.
 This figure is a rather powerful blow-up. The discontinuty at x = -1
is shown as the diagonal line at the left.
Window: -1.127 < xx < -1.107, .492 < y < .508,
           where xx = x - a/2 y.

Color         i.c.  millions of iterations  Comments

green        (-1, .5105)  210 Orbit ranges over whole rhombus.
brown        (-1, .509)    13 Eventually escapes to join green.
magenta (-.984149,.0742484) 1 Pete's orbit (b) in the paper.
red  (-.99991472, .5061287) 1 Close to an invariant curve.
cyan         (-1, .5058)   51
dark blue    (-1, .505)    10
blue (-.99860194,.50405996) 2 note the three-fold pattern
salmon       (-1, .503)    20
purple       (-1, .4995)    5
Plus, there are many circular orbits that are not listed here.