Information about the Third blow-up of the Overflow Map
Information about the Third blow-up of the Overflow Map
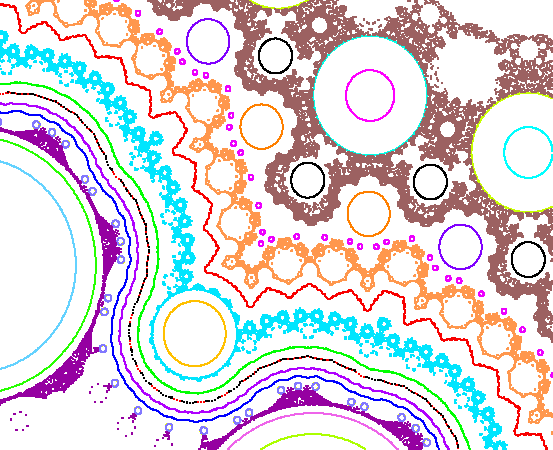 This blow up shows magenta circles surrounding the `invariant curve'
mentioned in Pete Ashwin's paper, and the red `invariant curve' I found.
This blow up shows magenta circles surrounding the `invariant curve'
mentioned in Pete Ashwin's paper, and the red `invariant curve' I found.
A better candidate for a probably invariant curve would be in the band
of near-invariant curves seen in this figure.
(They are blue, purple, black/red, and green).
The black/red pair are two different initial conditions of the form
(x, y) and (-x, -y), and the black has over-written some of the red points
at this resolution.
To be honest, this figure is not a blow-up of the `second blow up.'
It is
a blow-up of the
central island.
![[Back]](/jws8/image/back.gif) Overflow map page
Overflow map page
Jim Swift's home page
Department of Mathematics
NAU Home Page