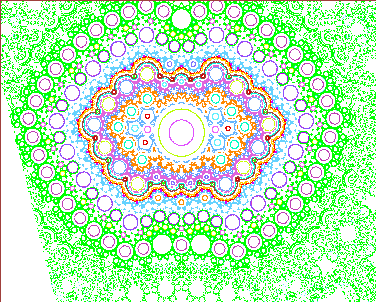
 This is an exploration of figure 2(d) in
``Non-smooth invariant circles in digital overflow oscillations''
by Peter Ashwin, NDES 96. For more informations see the list
of publications at his
web site .
 This is an exploration of figure 2(d) in
``Non-smooth invariant circles in digital overflow oscillations''
by Peter Ashwin, NDES 96. For more informations see the list
of publications at his
web site .
Window: -1.018 < xx < -0.9805,  0.05 < y < 0.08,
           where xx = 1 - a/2 y.
This is the smallest xx-y rectangle that includes Pete's fig. 2b and 2d.
That figure fits in a rhombus that extends to the upper-left and
lower-right corners of this figure.