The Overflow Map
The Overflow Map
This area preserving discontinuous map of the torus (or rhombus) is
x' =  y
y' = -x + a y (mod 2)
In the figures on this site, a = 0.5.
The `mod 2' adds an even integer to put the point in the interval [-1, 1).
For more information see ``Non-smooth invariant circles in digital overflow
oscillations'' by
Peter Ashwin.
A similar map where x and y are in the interval [0, 1) is called
the doily map.
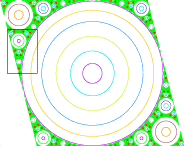
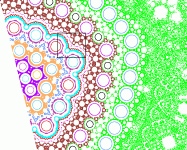
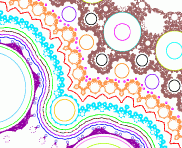
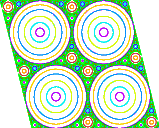
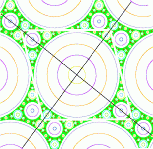
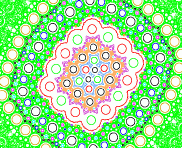
The figures show several trajectories with a = 0.5. The horizontal coordinate
is x - a/2 y, and the vertical coordinate is y. If one were to plot y vs. x,
the circles would be ellipses.
Click on one of the icons to see a larger version of the figure.

![[Back]](image/back.gif) Jim Swift's home page
Jim Swift's home page
![[Back]](image/back.gif) Department of Mathematics
Department of Mathematics
![[Back]](image/back.gif) NAU Home Page
NAU Home Page


